From Three Weeks to Three Days
GraphWitch — How a broken chart workflow became an AI-powered visualization tool that locks the data and opens everything else.
San Francisco, CA · Remote
4 weeks · 2026
Shipped · Live at graphwitch.com
Overview
A major IGO client needed more than one hundred data visualizations for a report cycle, on a deadline that left no room for the way things had always been done.
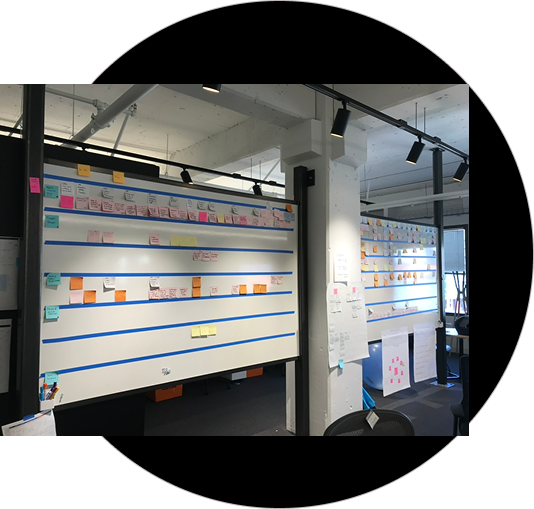
The existing process was pure manual labor: designers reconstructed every chart by hand in Illustrator from Excel files, Word documents, PowerPoint decks, and pasted email fragments.
The goal going in was modest: cut the manual workflow by at least half. The result was GraphWitch, a tool that finished the entire pipeline in three days, revisions included, and then kept growing on the open web.
Problem & approach
04 movesAI models hallucinated values and changed data silently, with no flag or warning.
Each revision round compounded the risk, while formats, style guides, and source data kept shifting beneath the team. Multiple stakeholders = multiple changes: in the data, the styles, the chart types and the formats. We needed a better solution. Multiple stakeholders = multiple changes: in the data, the styles, the chart types and the formats. We needed a better solution.
- 01
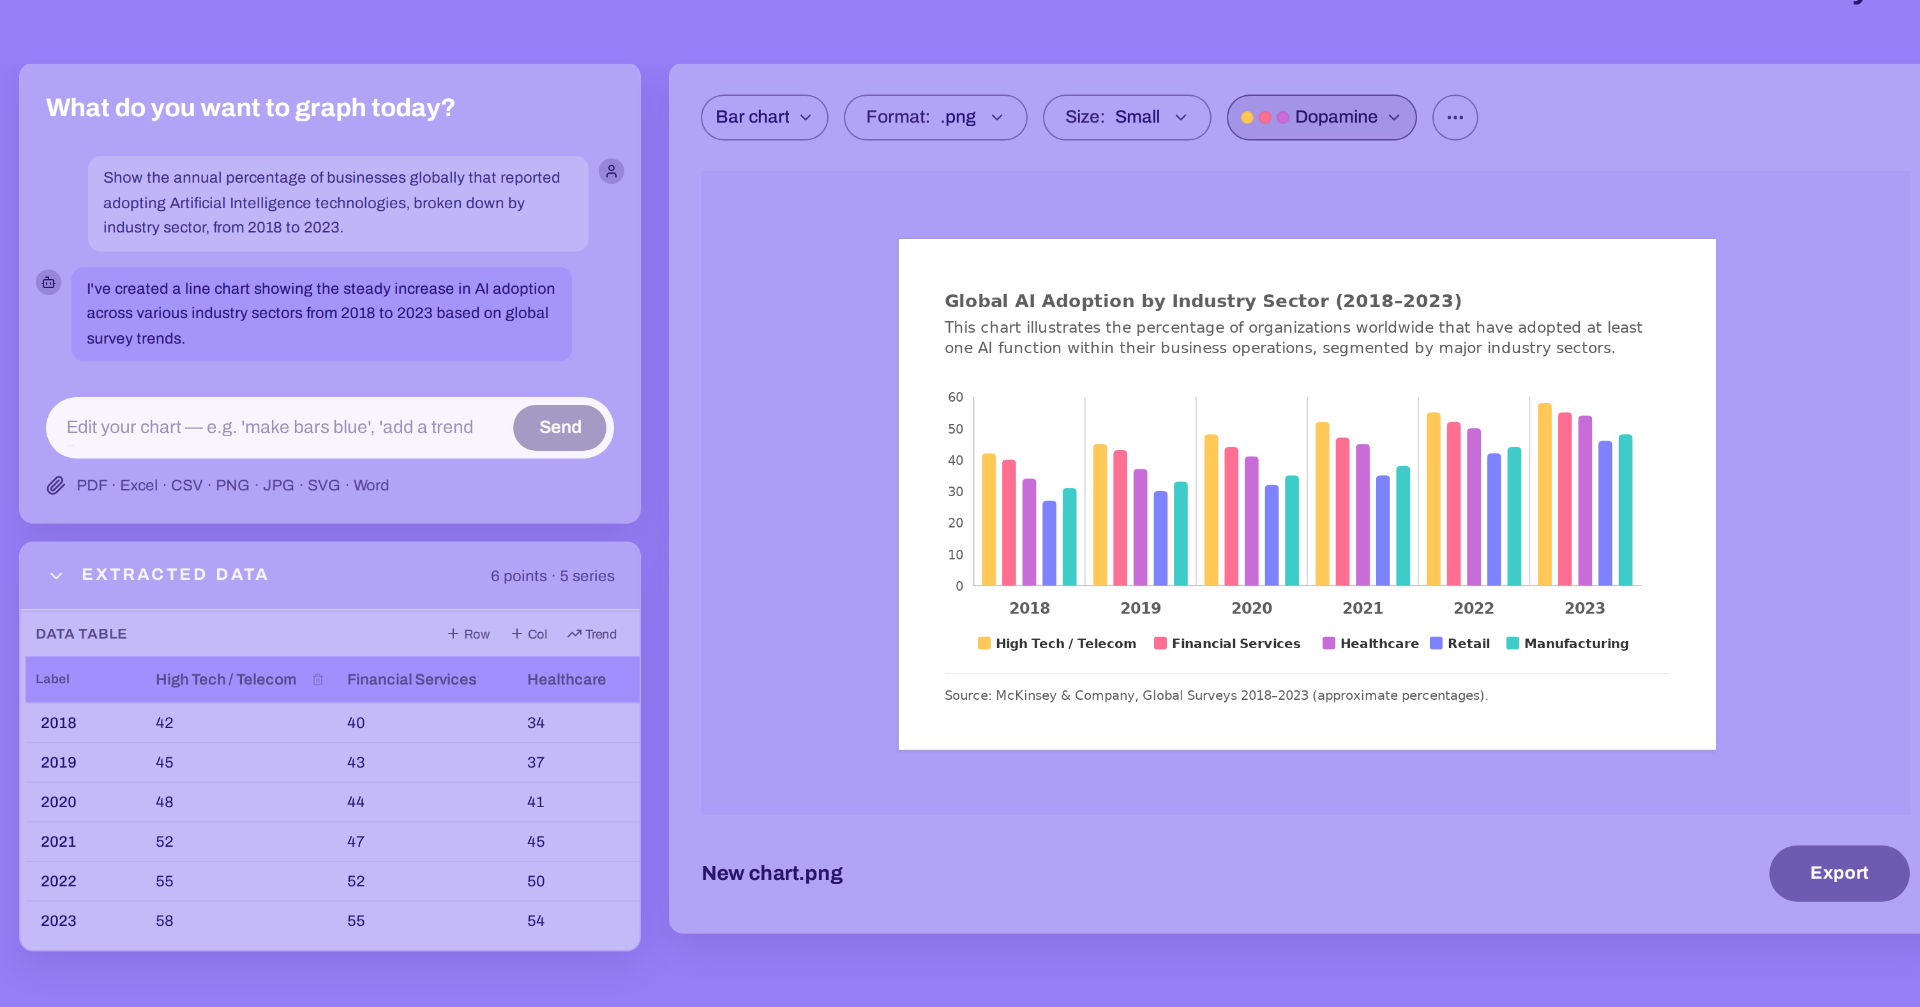
Built an AI agent wrapped in strict guardrails: chart type, format, and style stayed open; the numbers stayed locked.
- 02
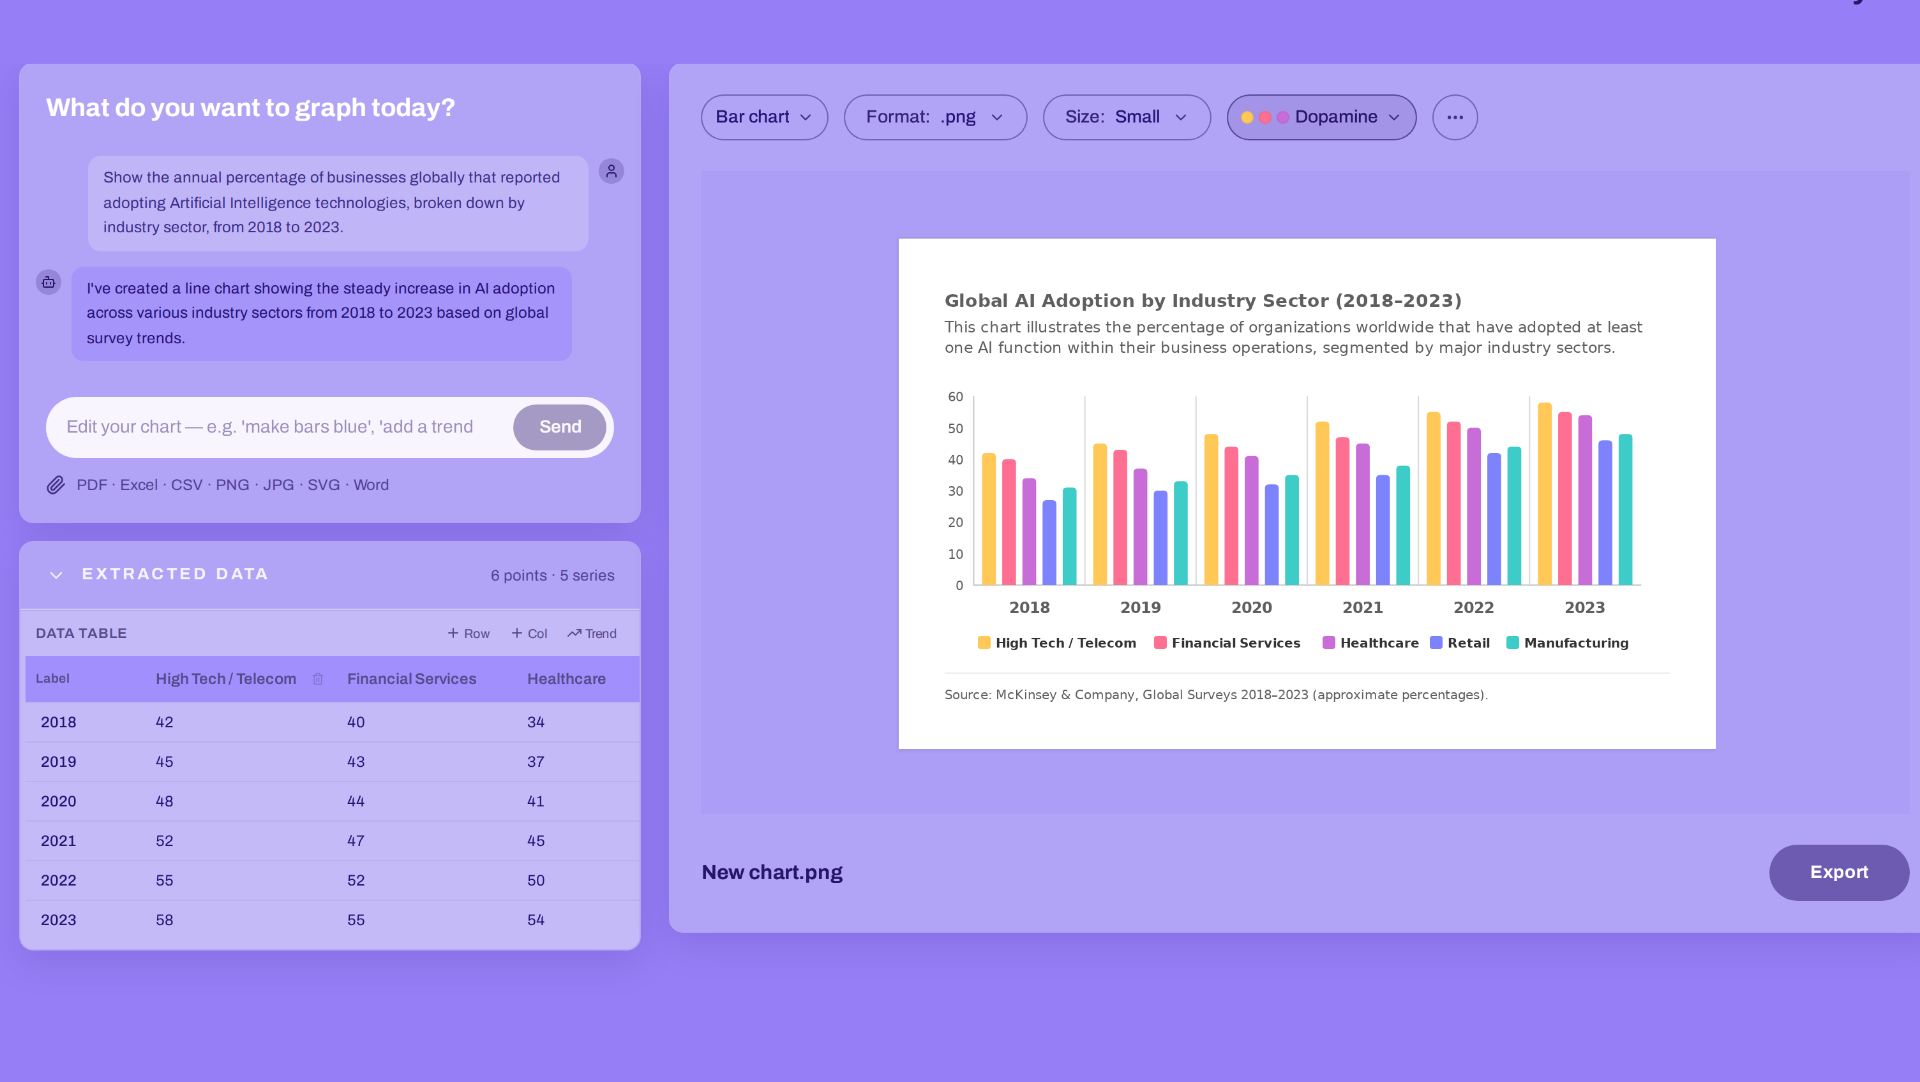
Shipped a graph builder where users upload nearly any filetype, including images, and work with AI to extract data and construct visualizations.
- 03
Added a style guide builder that generates an editable guide from a single image, with styleable variables and on-the-fly variations.
- 04
Exposed the underlying data behind every chart for direct inspection and correction, so client edits applied at the source instead of by hand.
Workflow
Before & afterBefore
- 01Collect data from disparate sources
- 02Check data for accuracy
- 03Build styleguide in Illustrator
- 04Build graph manually in Illustrator
After
Iteration
Shipping liveFeatures to fix problems, in realtime
Each new snag in the project became a feature request, and I shipped them multiple times a day.
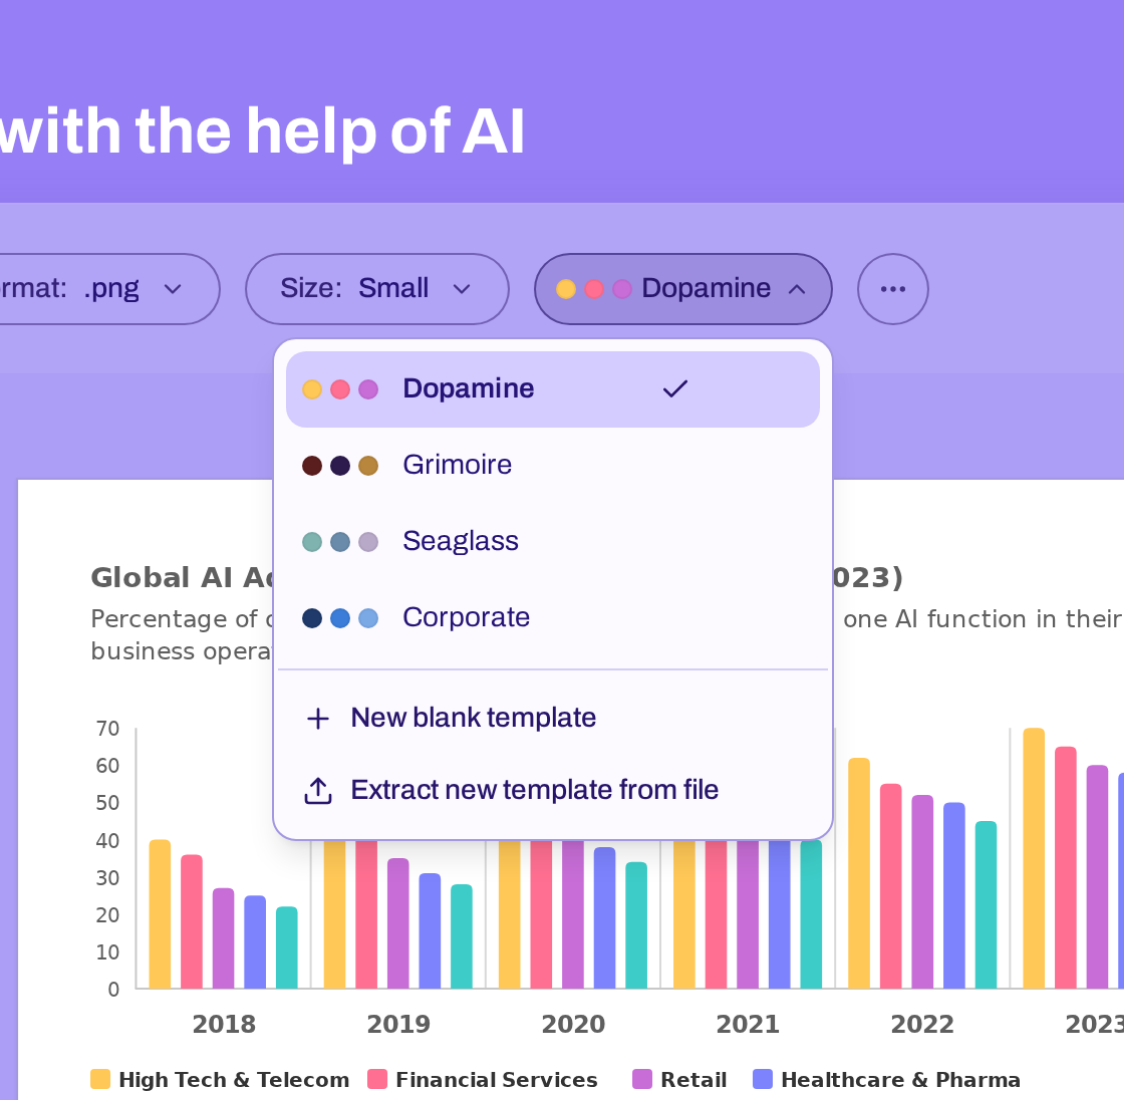
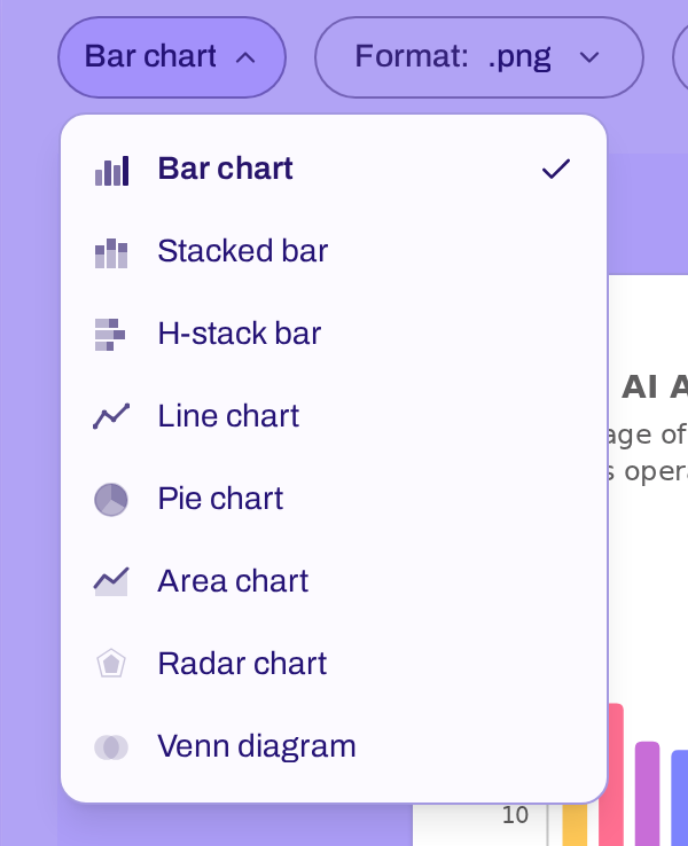
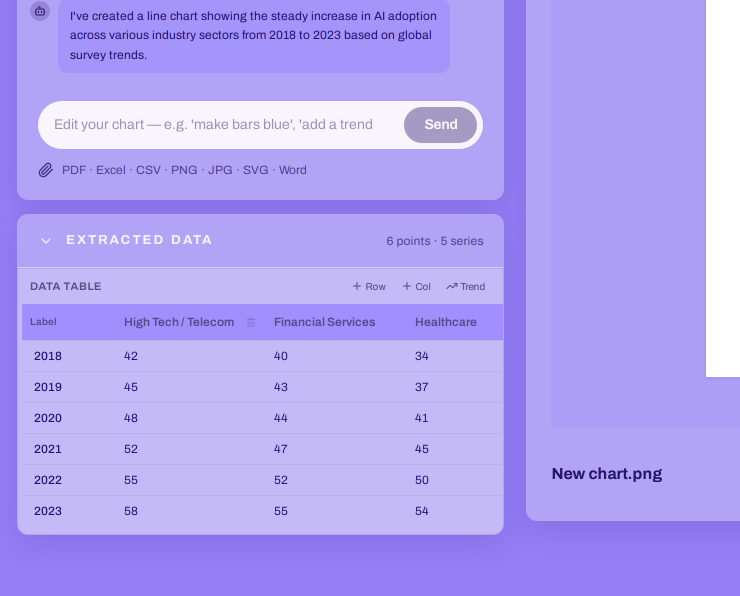
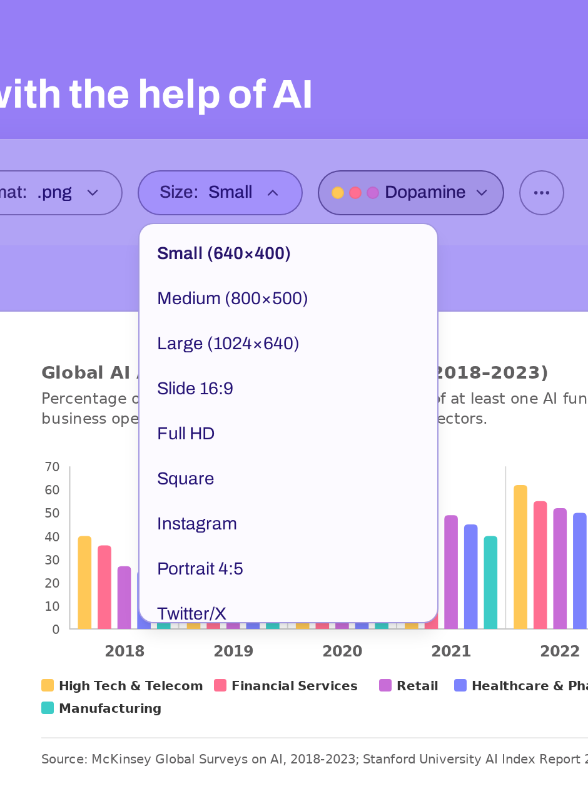
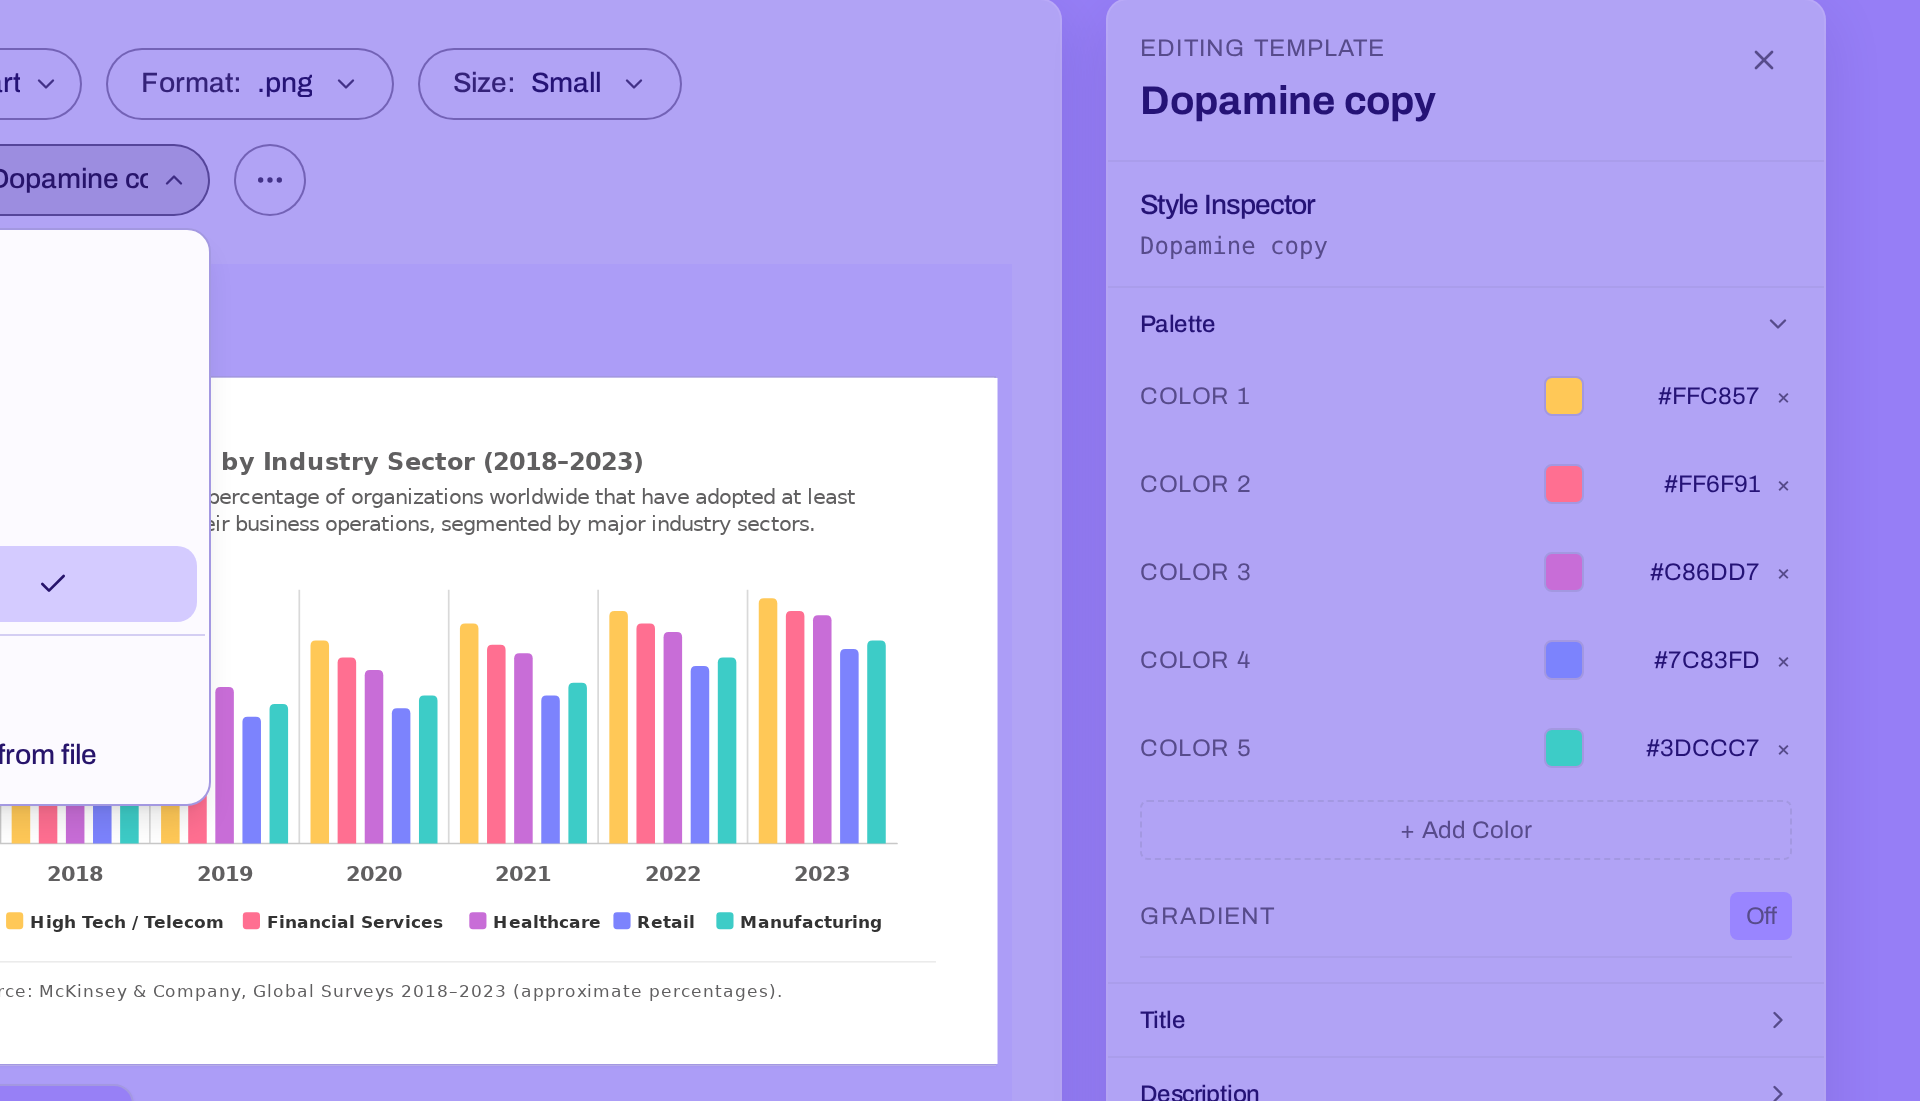
Upload any image and GraphWitch pulls a full color template out of it — ready to apply to any chart in a click.
- 01
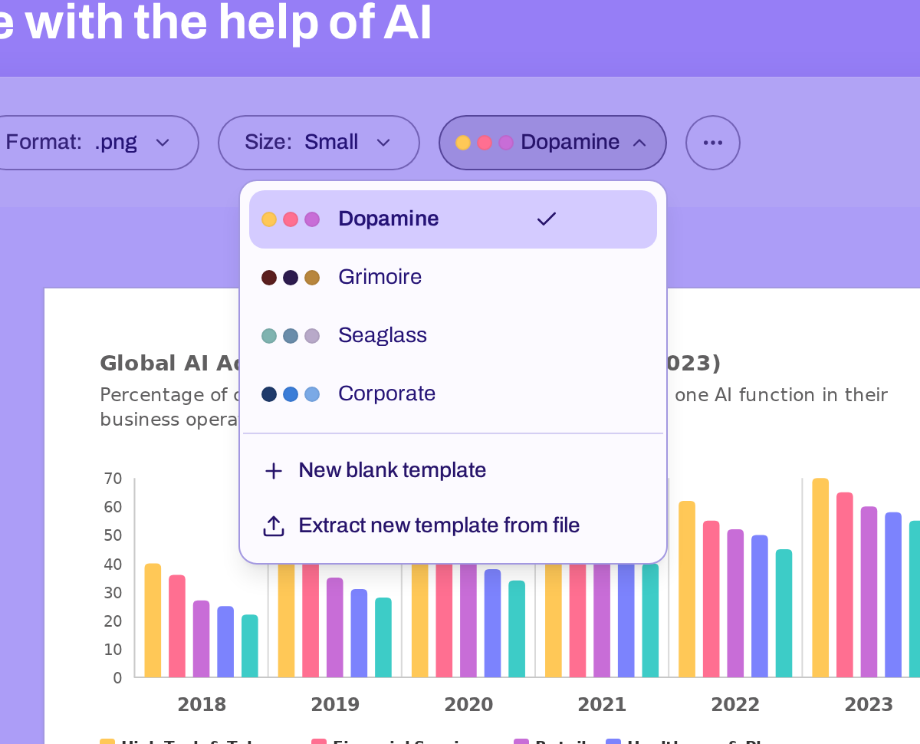
Start from any file — a screenshot, a photo, a client's brand deck.
- 02
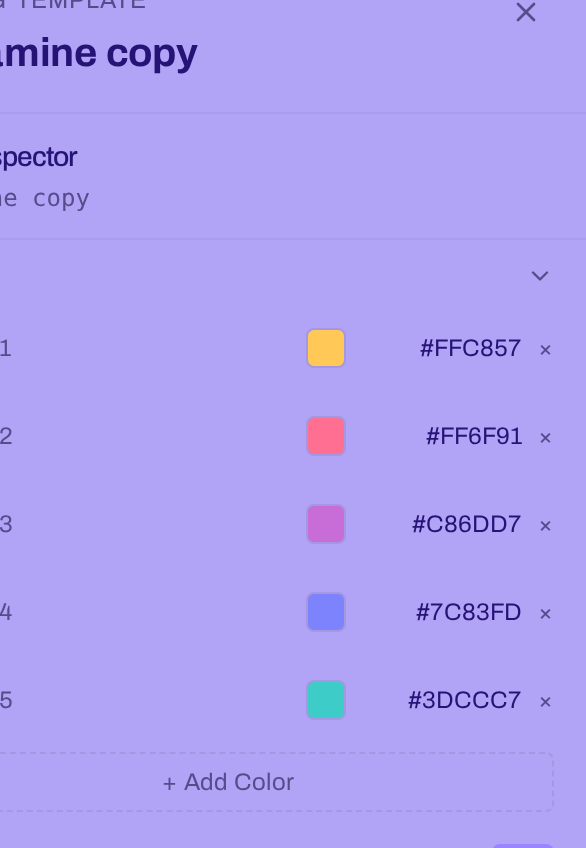
GraphWitch pulls a full palette straight out of the image.
- 03
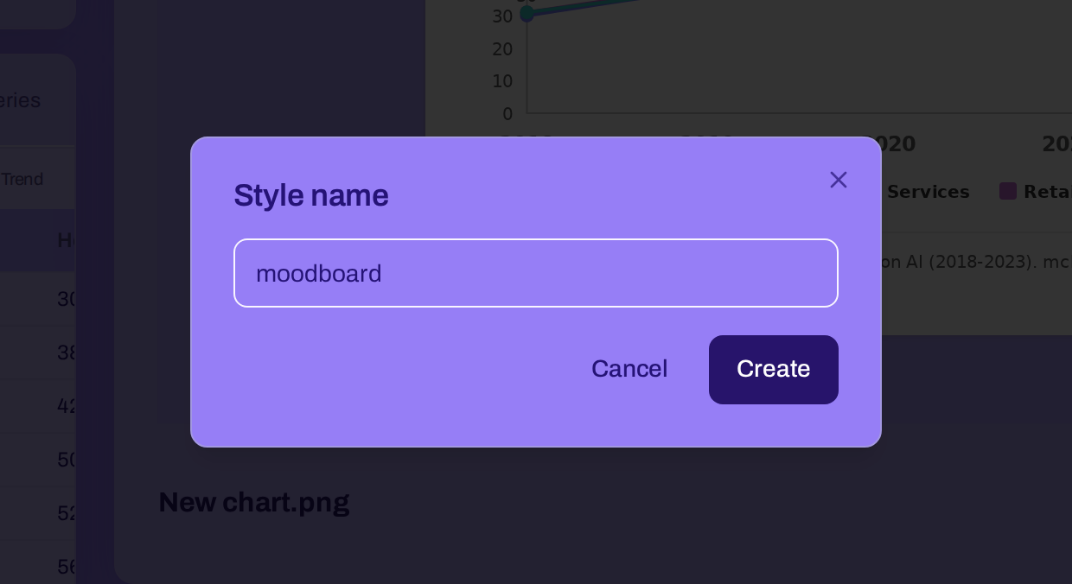
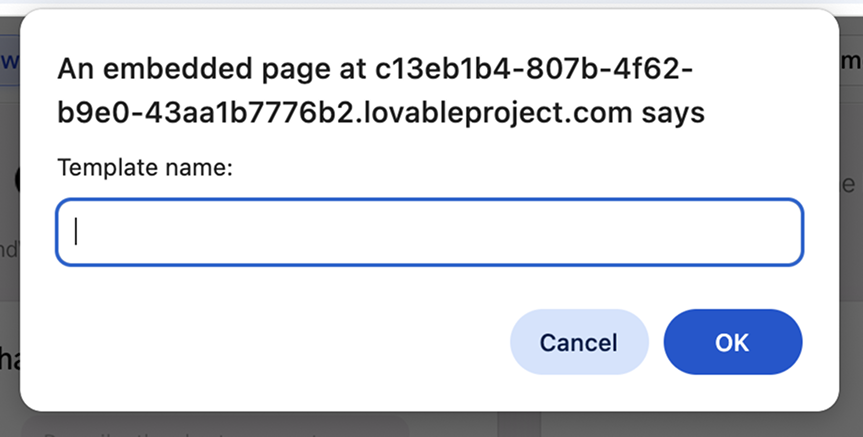
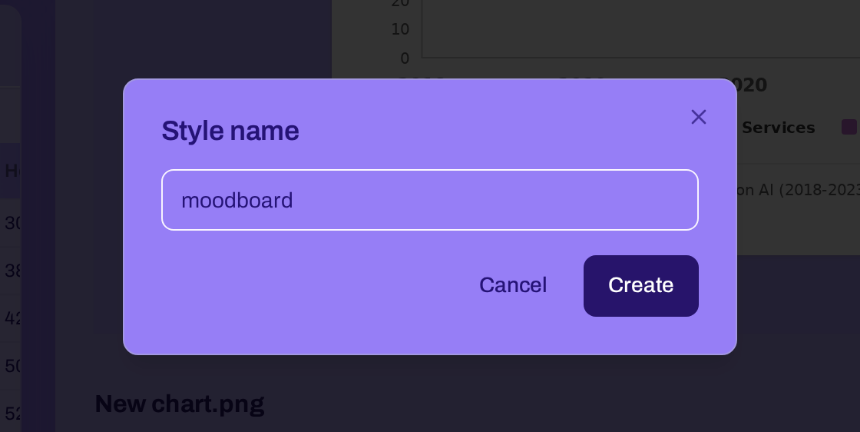
Name it, save it, and it lives alongside your other templates.
- 04
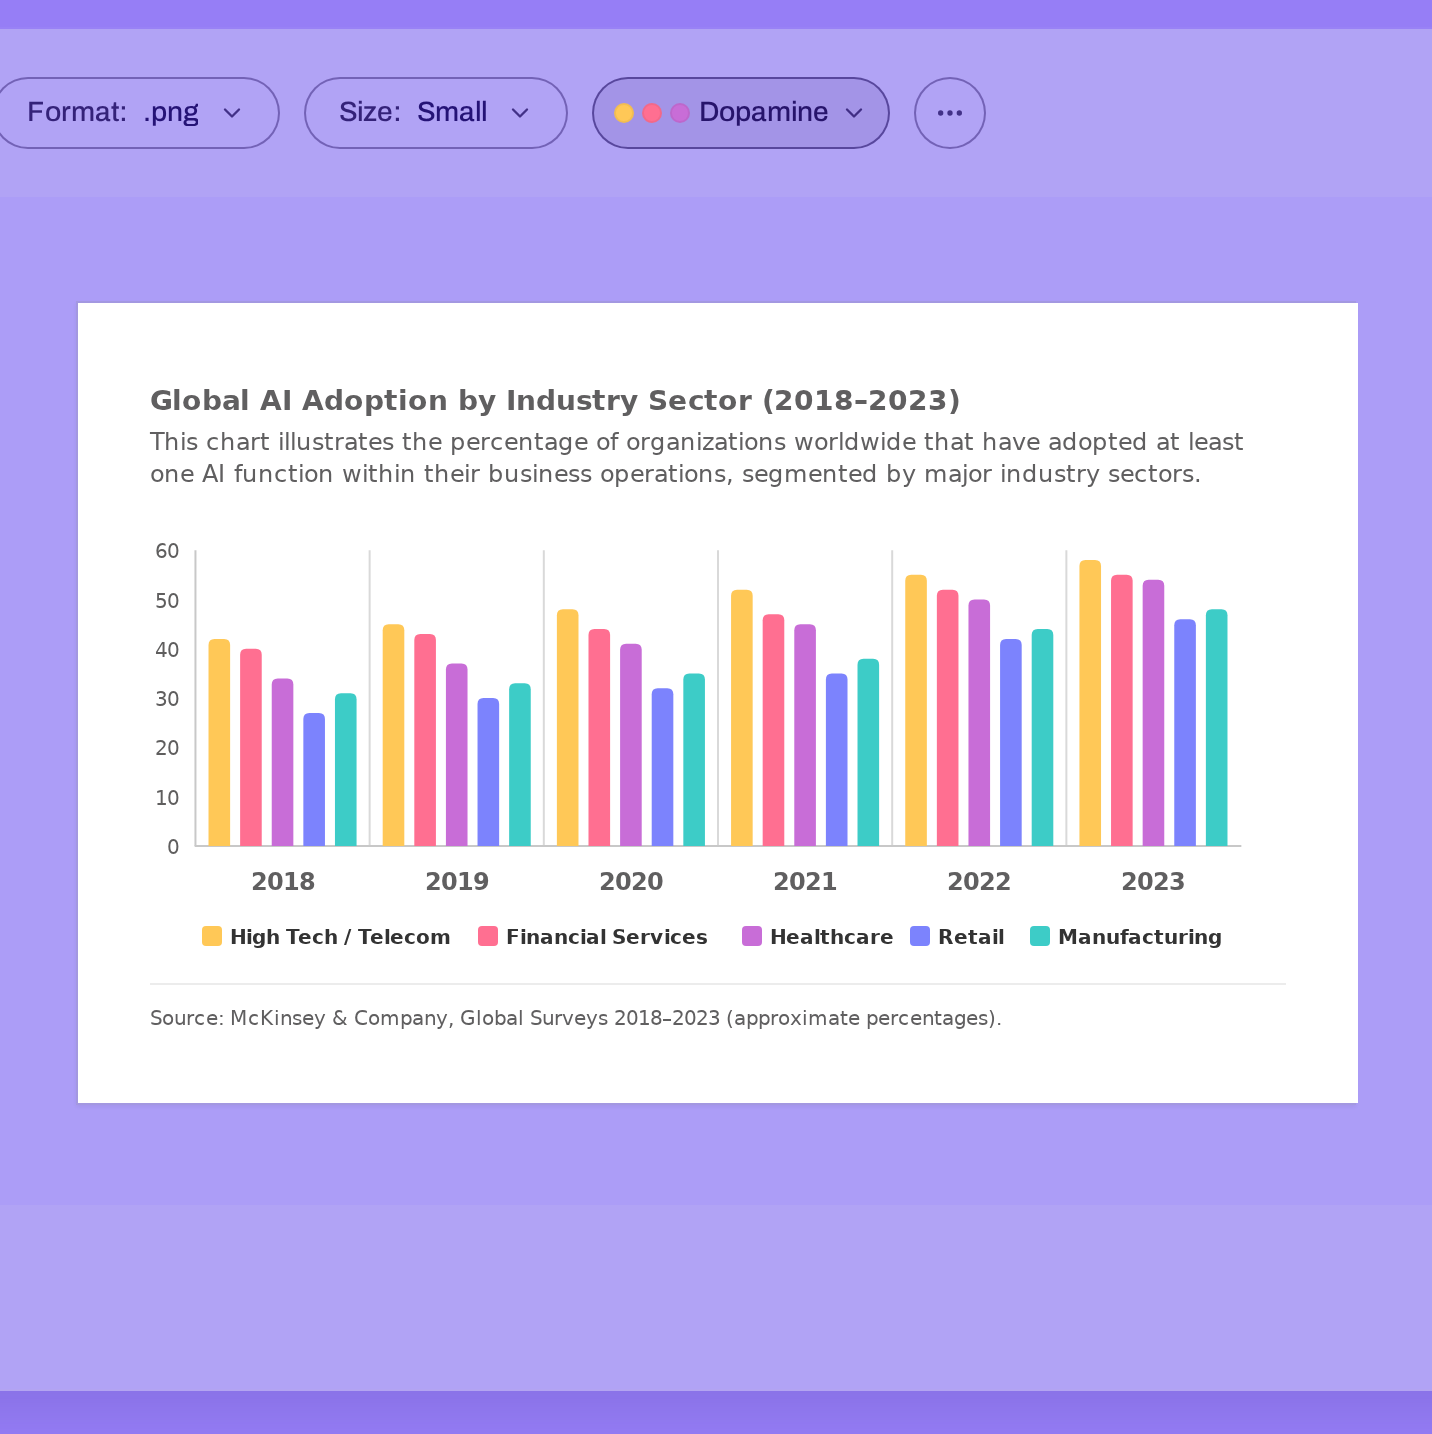
Apply it to any chart — instantly on-brand, no manual restyling.
Engagement rhythm
4 weeks · 2026Problem to production, under 5 days
- 01Day 1
Crisis
Manual workflow breaks under deadline; off-the-shelf AI silently corrupts data.
- 02Day 3
Prototype
First guardrailed agent: locked data, open styling, one happy IGO team.
- 03Day 5
Production
Shipped graph builder, style guide editor, data panel, and multi-format exporter.
- 04Day 30
Public launch
Published on the open web; rebuilt interface around reliability, transparency, and ease.
Craft
Post-ship polishPolishing the craft
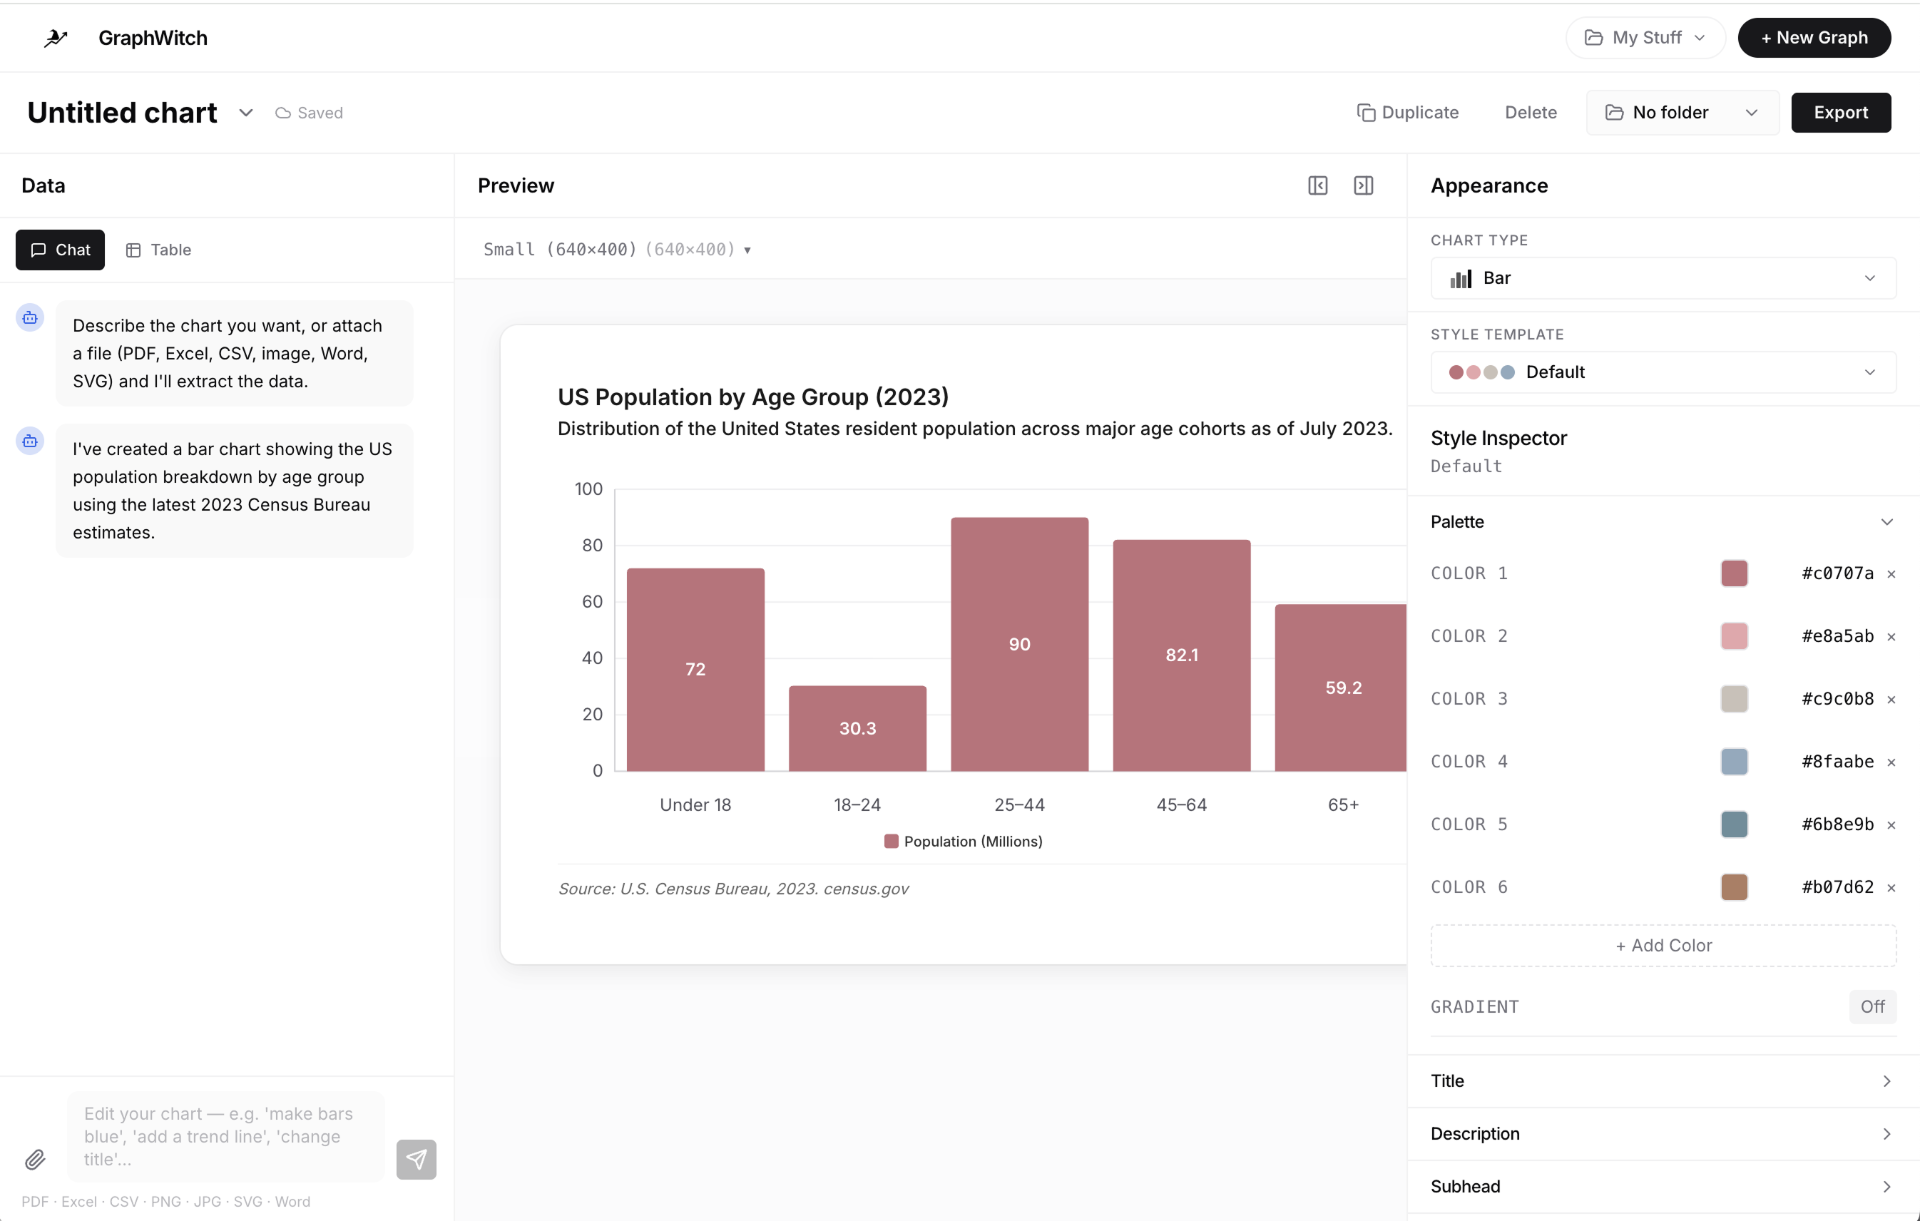
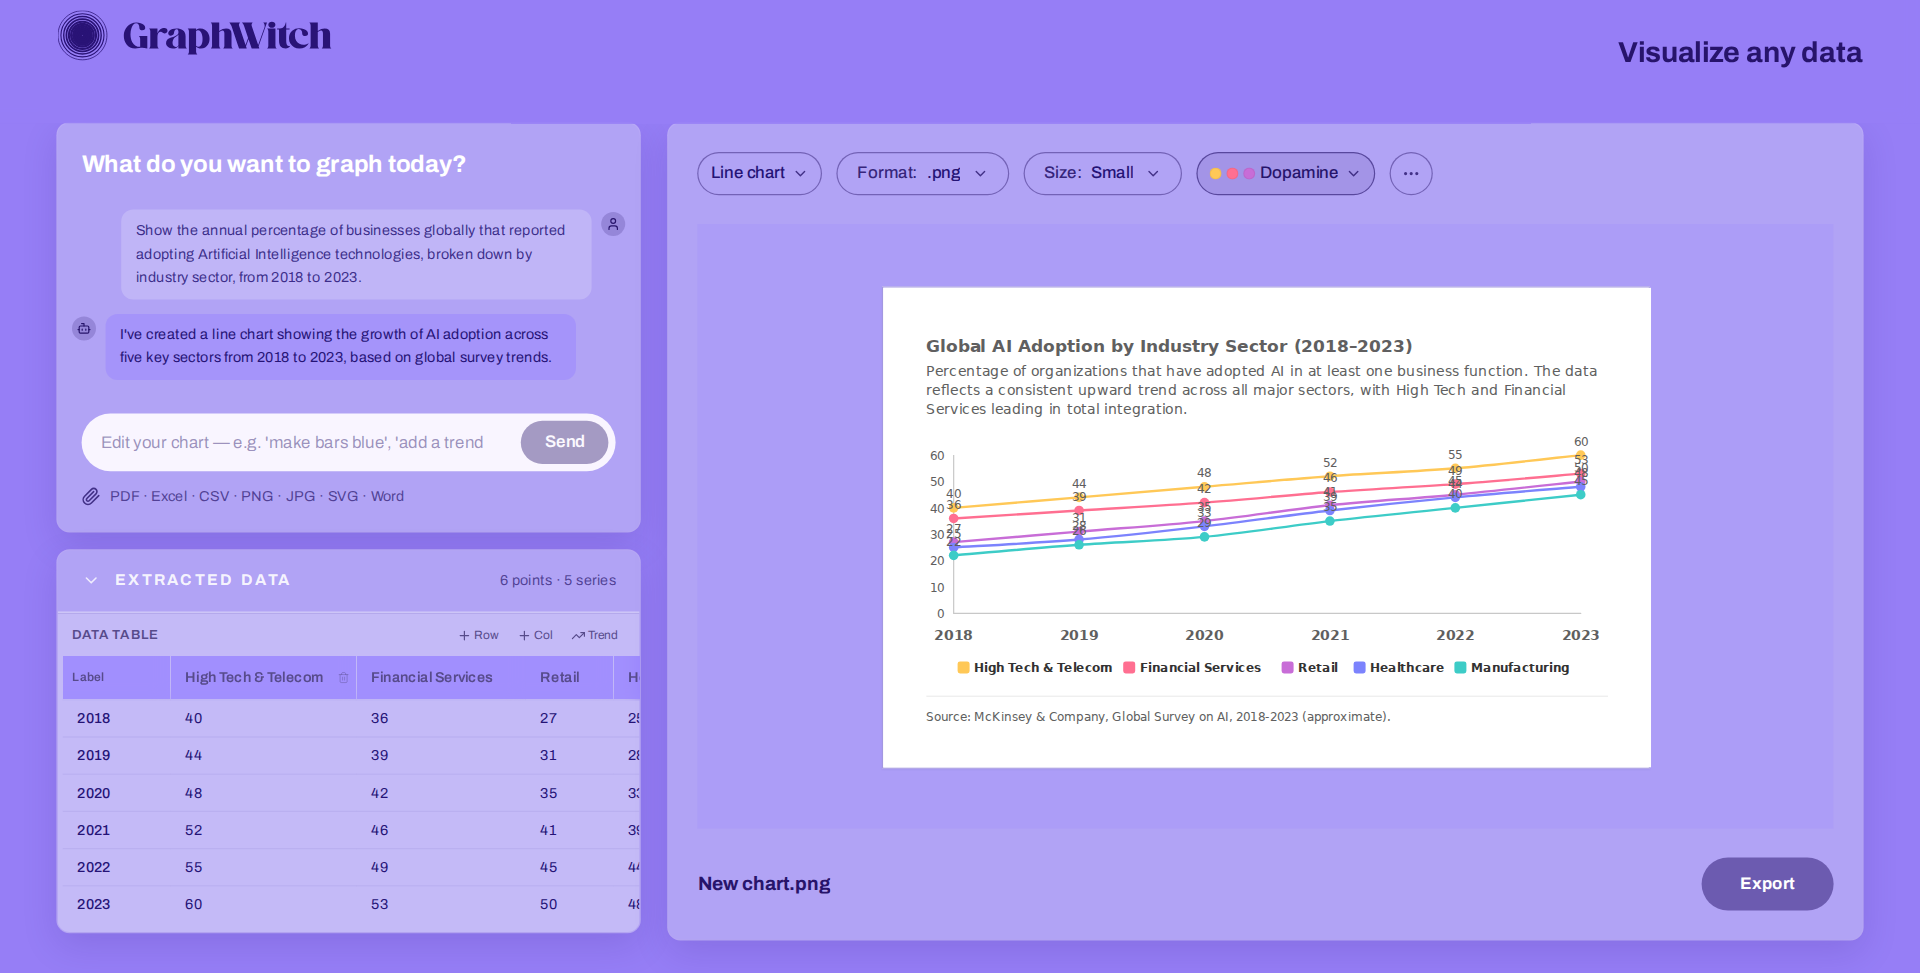
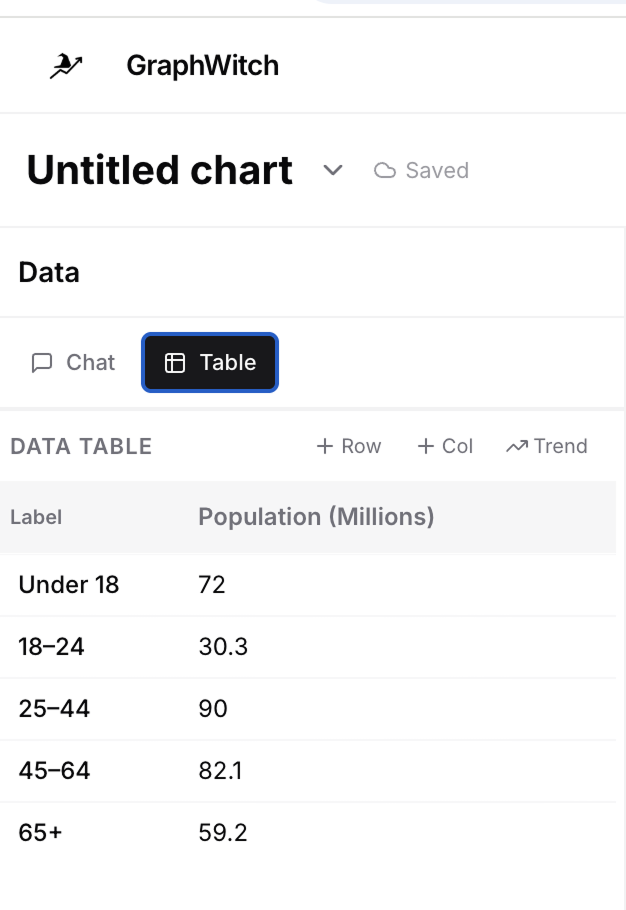
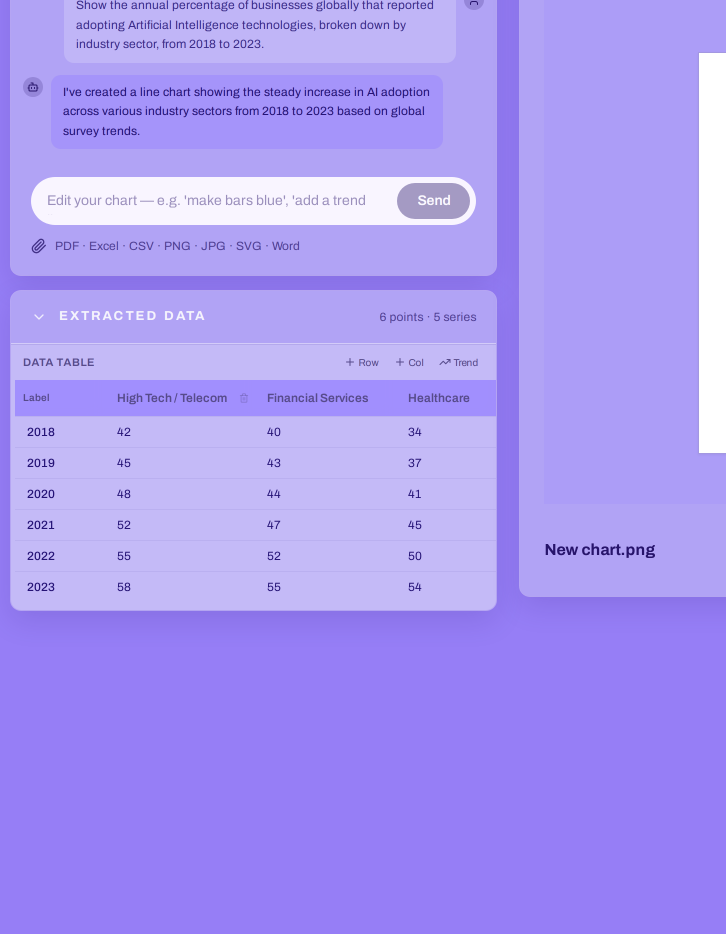
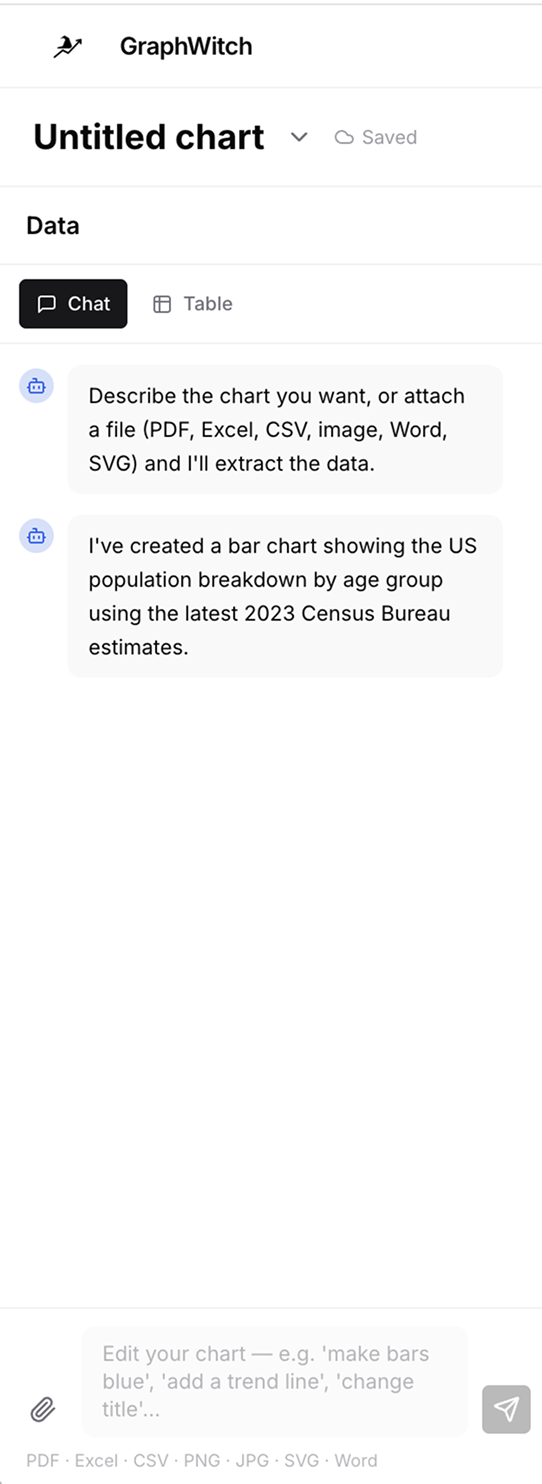
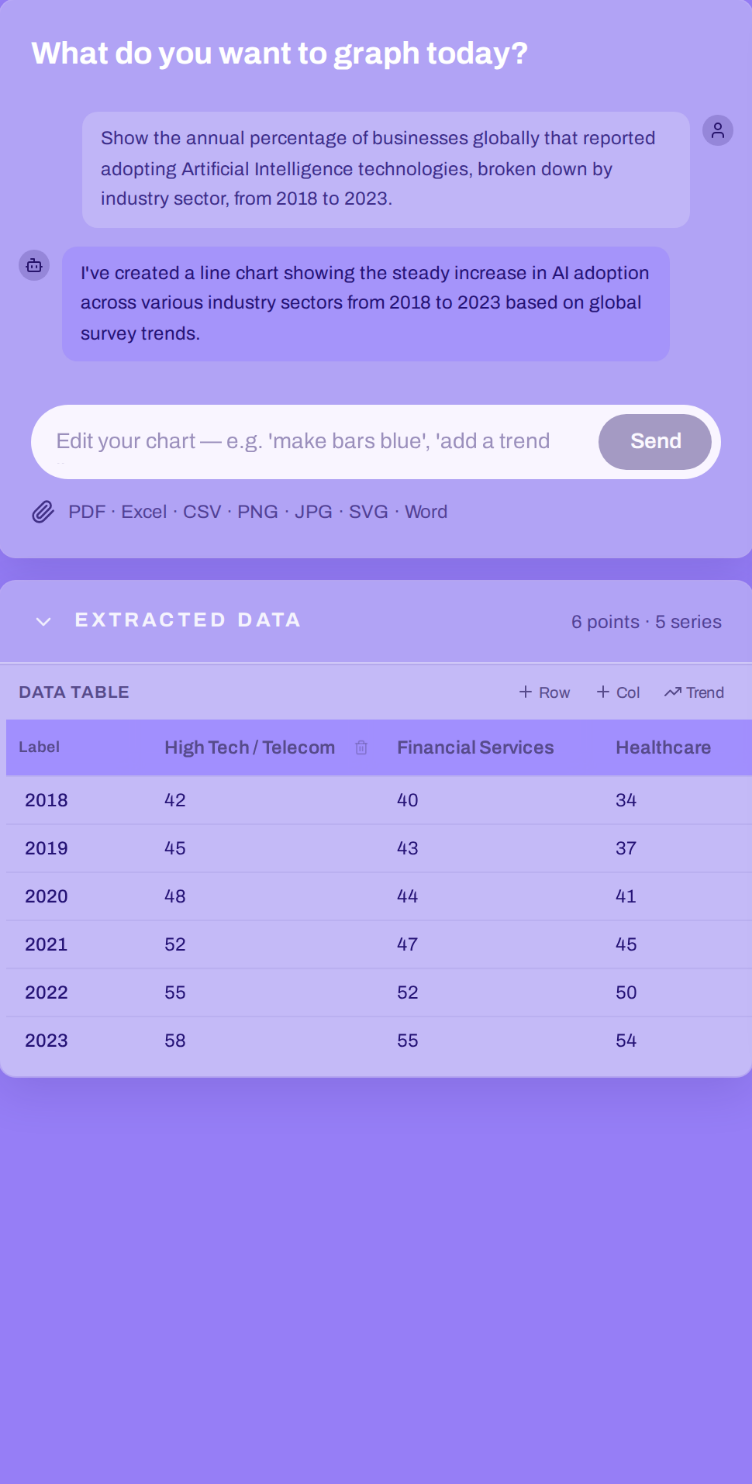
Because I built for real-world needs on a deadline, the first version of the app was not exactly beautiful: it used default design patterns generated by Claude and Lovable. After the chart project shipped, I spent the time to fix major usability and visual design issues to make this usable for everyone, not just us.
Launch
Live productSetting it loose: real users, no marketing
After the IGO project wrapped successfully, I wanted to see if the Graphwitch would be useful to other people too...so I published the site and made it free for all users. After just a few days, people started finding it – and using it. With no marketing or promotional efforts, people from all over the world were discovering this tool and using it, often for very long sessions. I'm watching closely, and gearing up to take it to the next level and turn this into a real, profitable product...stay tuned!
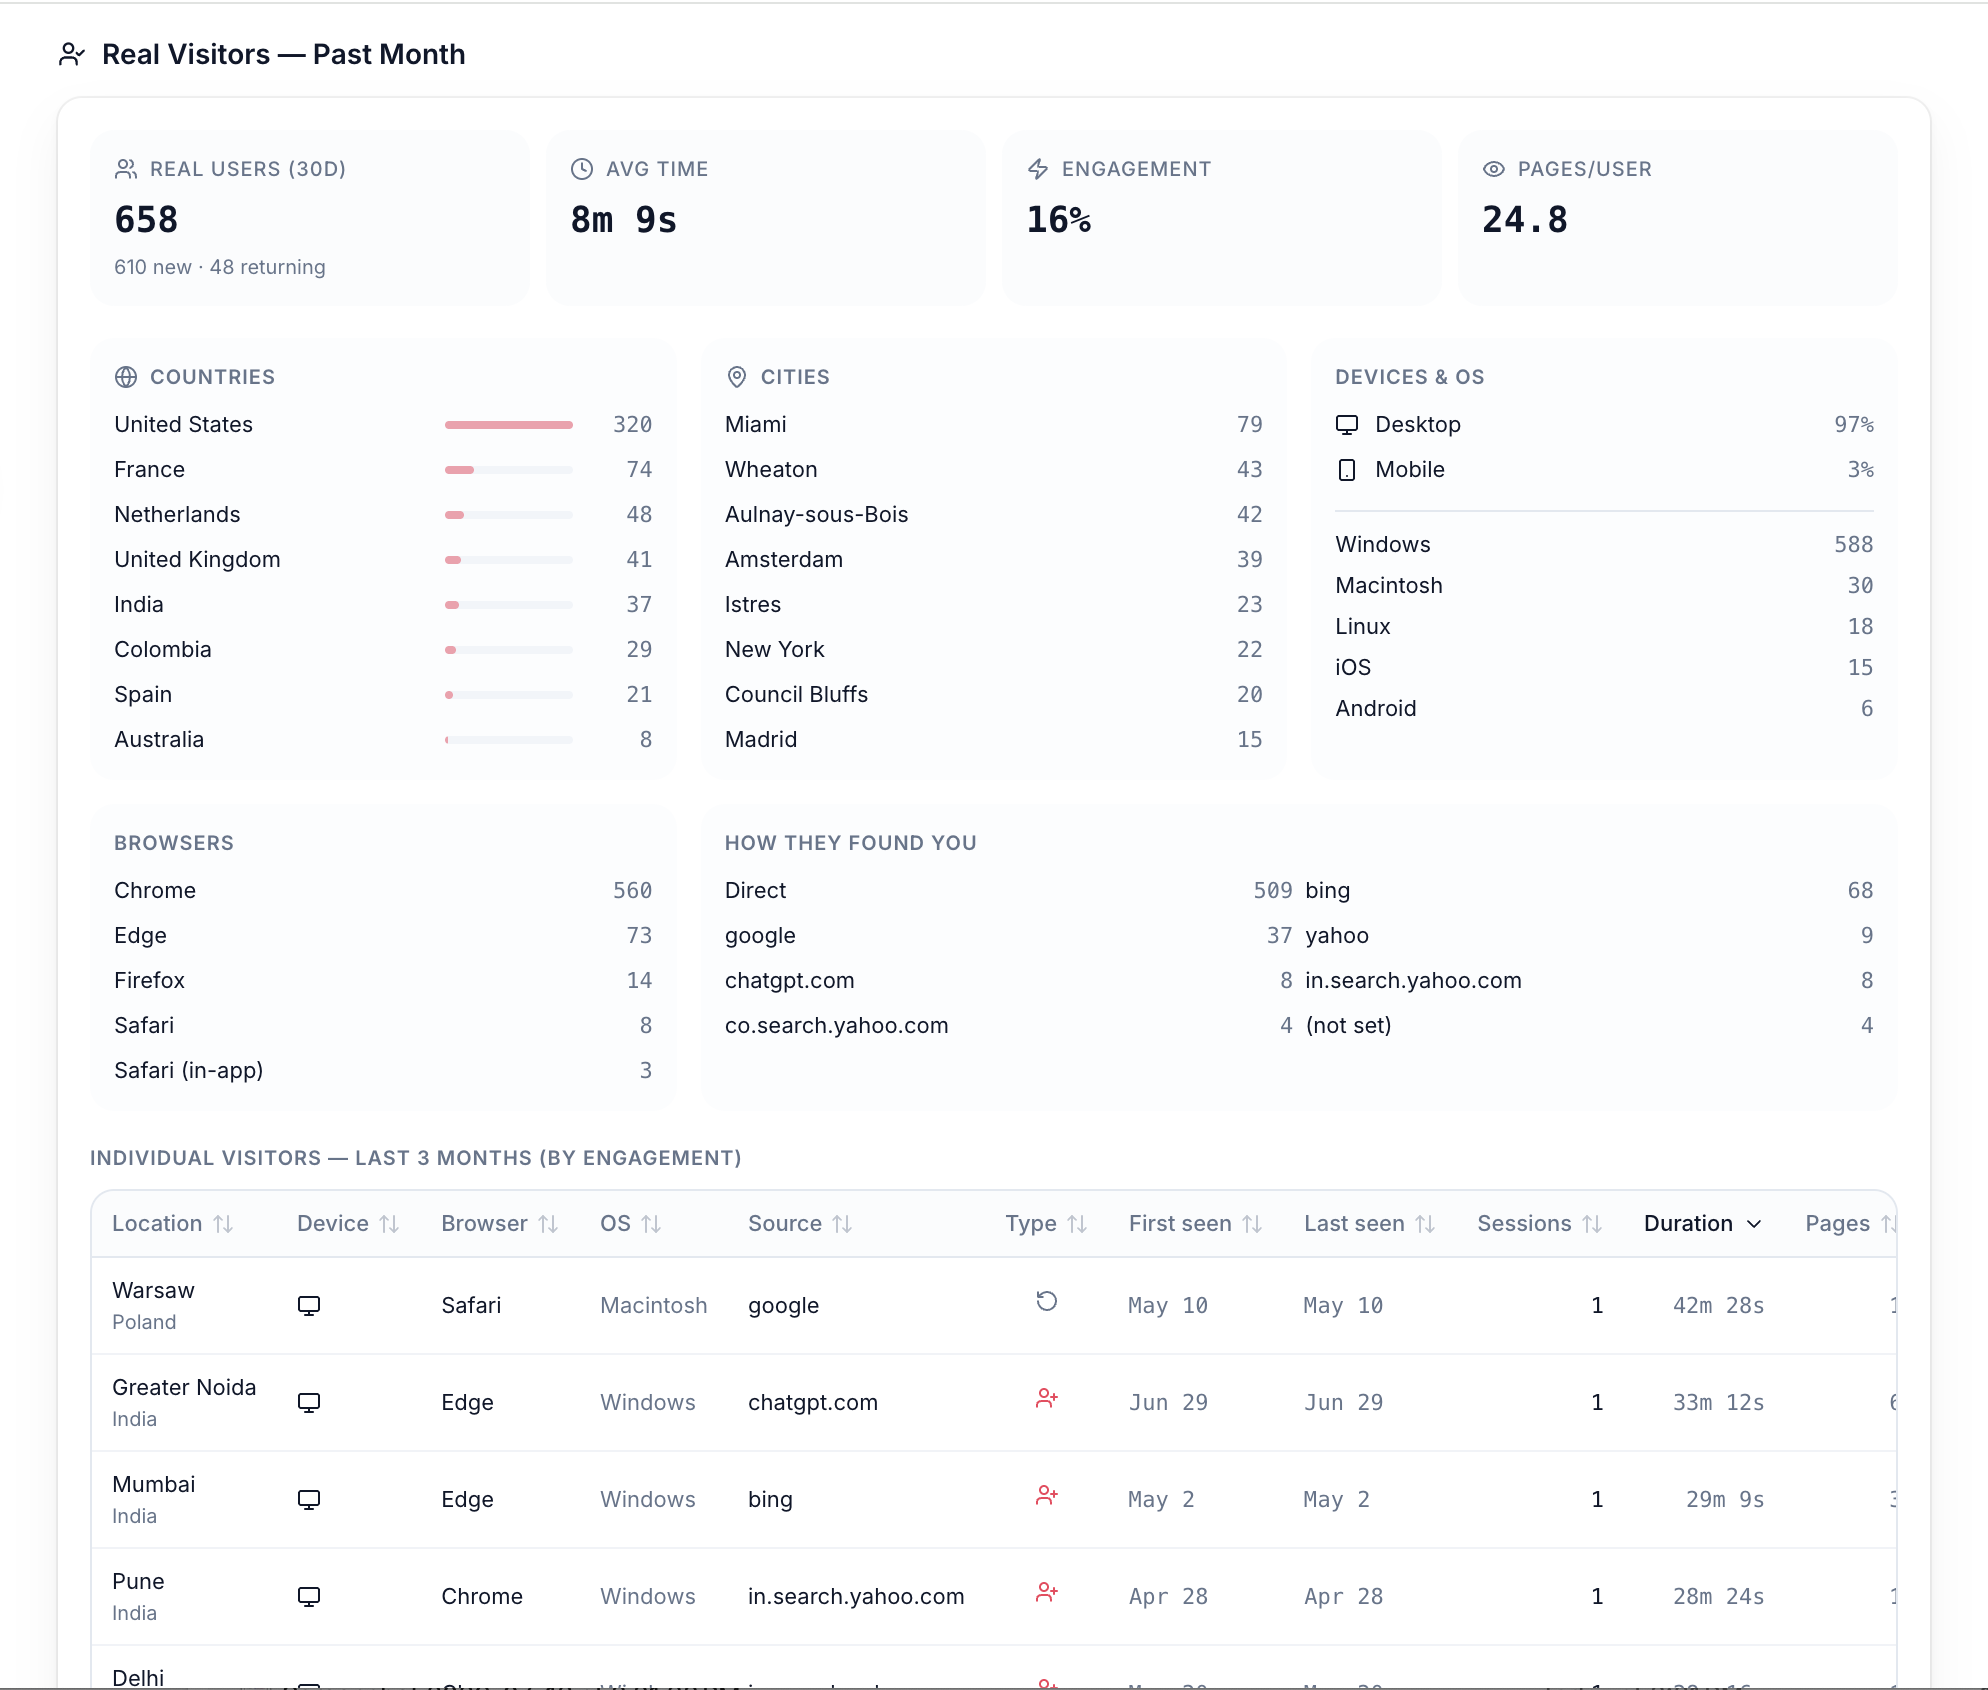
LIVE SITE OUTCOME — MEASURED
InstrumentedA chart tool that cannot be trusted with the data is not a chart tool.
Credits
- Founder & Builder
- Ellen Drewes
- Platform
- Lovable · Codex · Claude
- Client
- Major IGO (confidential)